


")


Analysis
Spike2 has built-in detection of waveform features, measurements of latencies, amplitudes and areas as well as averages and trend plots. Further custom analysis functions can be applied via a script language.
- Generate tachogram channels based on detected waveform complex segments, such as ECG R-waves for heart rate variability studies
- Locate repolarisation percentages and measure latencies from cardiac action potentials
- Measure systolic and diastolic blood pressures on a beat-by-beat basis. Use detected peaks and troughs to calculate and plot mean blood pressure
- Mark and measure responses to drug applications
Waveform processing

This video tutorial shows how to generate heart rate
blood pressure trace using active cursors
Spike2 can apply channel processes (for example, rectification and smoothing) on-line and off-line to aid with the detection and measurement of waveform features. Virtual channels allow inter-channel arithmetic, such as calculating the third lead in Einthoven's triangle.
- Locate and mark points of interest in processed data. Use these reference markers to take measurements from the original signal
- Data processing options include digital filtering and smoothing to reduce noise and unwanted frequencies, differentiation to enable detection of hard to find components, and DC remove to normalise the signal and minimise baseline drift
- Applied processes only affect the displayed data, not the original stored on disk
- Create duplicate channels to show raw and processed data simultaneously
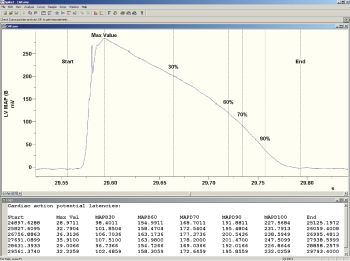
Cardiac action potential analysis
Measurements
Results from cursor positions, correlations, averages and script driven functions can be plotted and exported for further analysis, if required.
- Available measurements include: mean waveform value, slope, curve area, ratios, differences, and peak-to-peak amplitude
- Take multiple measurements based on cursor positions
- Plot results to new channels in the data file or XY scatter plots
- Export results to spreadsheet
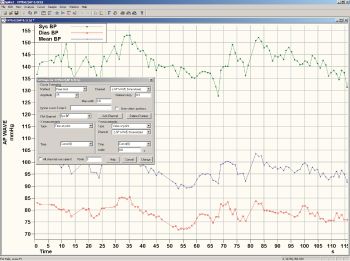
Trend plot of multiple measurements

Spike2 can perform on-line and off-line detection of waveform features and mark these in a new channel in the data file using the built-in active cursor and measurement functions. This video tutorial shows how to generate heart rate from a blood pressure trace.
© Copyright CED 2024
Registered in England: 00972132
Registered office:
- Cambridge Electronic Design Limited,
- Technical Centre,
- 139 Cambridge Road,
- Milton,
- Cambridge CB24 6AZ
- ENGLAND.
VAT: GB 214 2617 96
Producer registration number: WEE/BD0050TZ
For our US customers, we can provide tax form W-8BEN, that identifies us as a UK company.
CAGE/NCAGE: KB797
NAICS: 423490
Hardware: 84716070
Software: 85235190
By email:
By post:
- Cambridge Electronic Design Limited,
- Technical Centre,
- 139 Cambridge Road,
- Milton,
- Cambridge CB24 6AZ
- ENGLAND.
By telephone:
(Int.+44) (0)1223 420186
From North America (Toll Free):
1 800 345 7794