


")


Patch clamp
Signal incorporates many powerful features for whole cell and single channel experiments that make it ideal for electrophysiological recording. Familiar terms, and easily set up protocols for standard requirements enable the user to get started quickly using Signal and a CED 1401 data acquisition interface. Signal also incorporates an import function allowing you to analyse data from other recording systems.
Clamp specific sampling support
- Nominate a particular recording state to be used for seal and membrane resistance measurements.
- Easy adjustment of holding potentials.
- Dynamic readout of seal resistance.
- Support for dynamic clamp studies with up to 15 selectable conductance models. Update rates of over 300kHz without timing jitter - see details.
Single channel patch clamp analysis
- Membrane analysis option displays measurements of total resistance, access and membrane conductance, capacitive transient decay time constant and membrane capacitance.
- Display selected measurements as a graph against time.
Amplifier communication
- Telegraph communication to set channel scales based on voltages supplied from a wide range of patch clamp amplifiers.
- Direct software communication with Molecular Devices MultiClamp 700 and Axoclamp 900 amplifiers. Reads values for gains, filter settings, membrane capacitance, series resistance and external command sensitivity. The values read are stored in the Signal data file.
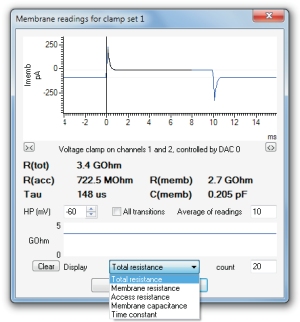
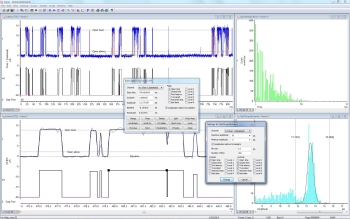
Membrane analysis during sampling
Stimulus generation
- Generate stimuli on up to 8 DACs and 8 TTL lines
- Define as many as 256 sets of up to 500 pulses
- Set stimuli at a fixed level or relative to an adjustable holding potential or current
- Output multiple sets of arbitrary waveforms per sweep. Waveforms are held in 1401 memory for very accurate timing
- Sequence through sets of pulses manually, cyclically, randomly or by user-defined protocol
- Interactively edit, add and remove stimuli while recording
- Define pulses with fixed or stepping amplitudes and durations
- Pulse types include square waves, ramp, sinusoid, pulse trains and pre-recorded or user-generated waveforms, for example, recorded action potentials
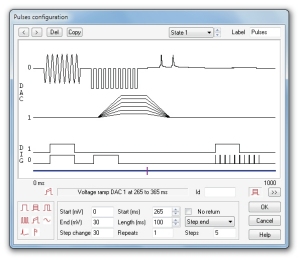
Pulse configuration dialog
Analysis
Leak subtraction
- 3 methods of defining leak data on-line and off-line
- On-line and off-line subtraction of scaled leak trace, including capacitive transients
- Subtract specific leaks on-line in current clamp using a selection of dynamic clamp models
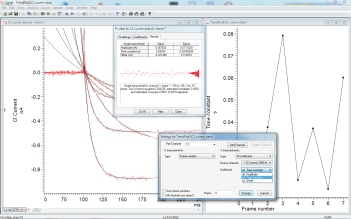
Measurement plots
The trend and measurement plot function in Signal generate graphs of measurements taken from the recorded data both on-line and off-line. For each frame selected, measurements are taken from individual or multiple events and plotted as X and Y coordinates. Typical examples would be the generation of an IV curve or measurements from multiple action potentials.
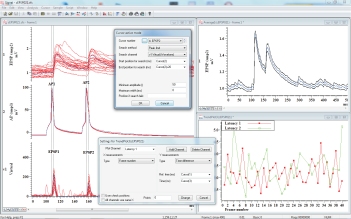
Analysis of paired recording from a pyramidal cell
connected with a fast spiking interneurone in the cortex†
Curve fits
Fit mathematical functions to original or leak subtracted data and trend plots.- Fit types include:
- Exponential, first or second order
- Gaussian, one or two
- Polynomials from first to fifth order
- Sigmoid (Boltzmann) curve
- Gives best fit coefficients and an estimate of confidence
- Display fit coefficients in trend plots
Exponential curve fitting on multiple traces
Single channel analysis
Idealised trace generation converts the waveform to a set of events describing the state of the channel(s) at the time of each transition point. Details include time, duration, mean amplitude and flags for open/closed, first latency and level - see a video demonstration.
- View details of individual events. Edit events by dragging times and levels or setting values in a dialog
- Detect short events using SCAN analysis for improved accuracy
- Insert and remove events interactively
- Produce amplitude histograms from original data
- Generate open/closed time histograms and burst duration histograms from idealised traces
- Select events to include/exclude based on associated flags
- Generate idealised traces on-line as well as off-line

This video tutorial demonstrates how to analyse single
channel data using the threshold detection method.

Signal has a number of features for single channel patch clamp data analysis, including idealized trace formation using threshold detection, and generation of dwell time and amplitude histograms. This video tutorial demonstrates how to analyse single channel data using the threshold detection method.
© Copyright CED 2024
Registered in England: 00972132
Registered office:
- Cambridge Electronic Design Limited,
- Technical Centre,
- 139 Cambridge Road,
- Milton,
- Cambridge CB24 6AZ
- ENGLAND.
VAT: GB 214 2617 96
Producer registration number: WEE/BD0050TZ
For our US customers, we can provide tax form W-8BEN, that identifies us as a UK company.
CAGE/NCAGE: KB797
NAICS: 423490
Hardware: 84716070
Software: 85235190
By email:
By post:
- Cambridge Electronic Design Limited,
- Technical Centre,
- 139 Cambridge Road,
- Milton,
- Cambridge CB24 6AZ
- ENGLAND.
By telephone:
(Int.+44) (0)1223 420186
From North America (Toll Free):
1 800 345 7794