Analysis
Leak subtraction
- 3 methods of defining leak data on-line and off-line
- On-line and off-line subtraction of scaled leak trace, including capacitive transients
- Subtract specific leaks on-line in current clamp using a selection of dynamic clamp models
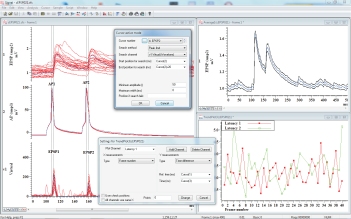
Measurement plots
The trend and measurement plot function in Signal generate graphs of measurements taken from the recorded data both on-line and off-line. For each frame selected, measurements are taken from individual or multiple events and plotted as X and Y coordinates. Typical examples would be the generation of an IV curve or measurements from multiple action potentials.

Analysis of paired recording from a pyramidal cell
connected with a fast spiking interneurone in the cortex†
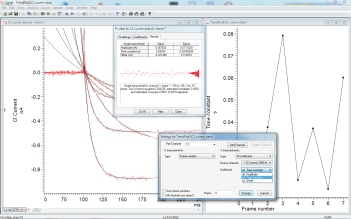
Curve fits
Fit mathematical functions to original or leak subtracted data and trend plots.
- Fit types include:
- Exponential, first or second order
- Gaussian, one or two
- Polynomials from first to fifth order
- Sigmoid (Boltzmann) curve
- Gives best fit coefficients and an estimate of confidence
- Display fit coefficients in trend plots

Exponential curve fitting on multiple traces
† Data courtesy of Dr. Afia Ali, London School of Pharmacy
Registered in England: 00972132
Registered office:
- Cambridge Electronic Design Limited,
- Technical Centre,
- 139 Cambridge Road,
- Milton,
- Cambridge CB24 6AZ
- ENGLAND.
VAT: GB 214 2617 96
Producer registration number: WEE/BD0050TZ
For our US customers, we can provide tax form W-8BEN, that identifies us as a UK company.
UEI : EQ4LMQ1M2ZS5
CAGE/NCAGE: KB797
NAICS: 423490
Hardware: 84716070
Software: 85235190
By email:
By post:
- Cambridge Electronic Design Limited,
- Technical Centre,
- 139 Cambridge Road,
- Milton,
- Cambridge CB24 6AZ
- ENGLAND.
By telephone:
(Int.+44) (0)1223 420186
From North America (Toll Free):
1 800 345 7794


